
原 GreenPlum中查询主机历史CPU、内存、磁盘、网络等情况(gpmetrics.gpcc_system_history)
Tags: 原创GreenPlumgpccOOMgpmetricsCommitLimitCommitted_ASgpmetrics.gpcc_system_history历史信息
简介
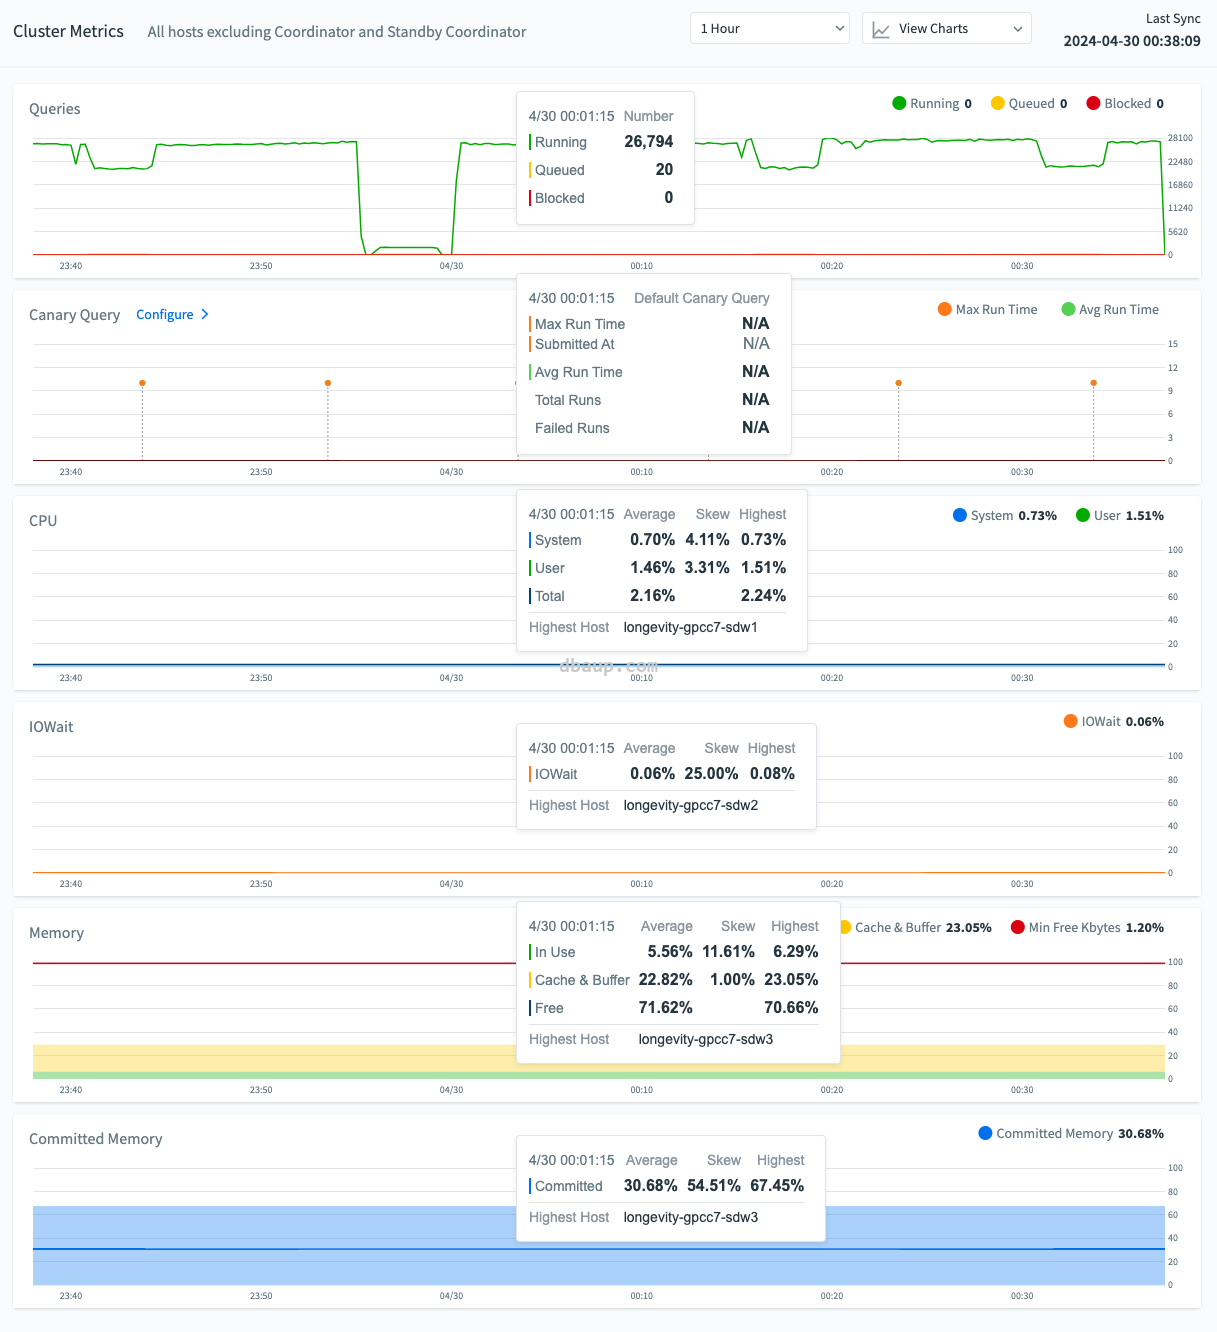
The Cluster Metrics page shows consolidated statistics for all segment hosts in the Greenplum cluster. Coordinator and standby coordinator hosts are excluded from the metrics.
Use the controls in the View Charts menu to choose which charts to display.
Choose the time period to display using the control in the top right corner of the screen: 1 hour, 4 hours, 1 day, or 3 days. The right side of the chart corresponds to the Last Sync time shown in the top right of the page.
On each chart, the colored circles next to each legend (for example, Running, Queued, Blocked, IOWait, and so forth) provide additional control over which data is displayed. Selected (solid) items are displayed on the graph, while unselected items are hidden.
Hover over any of the charts to see values for that point in time in pop-up boxes. The charts are synchronized so that hovering over any chart shows the same point in time in all charts.
- The coordinator and standby coordinator hosts are excluded from the metrics.
- When the metric is an average of values collected from all segment hosts, the host with the highest value is identified in the pop-up box.
- Solid lines trace the average value for all segment hosts. The stacked graphs represent the highest values for the metric at each point in time.
- The current value of a metric is shown in the upper right corner of its chart.
The page has charts for the following metrics:
Queries
The number of queries running and the number of queries queued to run.
Canary Queries
The periodic SQL statements used to monitor database response times and workload.
CPU
The percentage CPU used by system processes and the percentage CPU used by user processes. The chart represents the total of system and user CPU usage across the hosts. The system percentage includes IOWait time. Note that this is different than the CPU system percentage on the Host Metrics page, where IOWait time is not included in the system time. The average is the average of the total CPU usage (system plus user).
If both the System and User metrics are displayed, the solid line indicates the average of the total CPU used by both the system and users. If only one of the two metrics is displayed, then the solid line indicates the average of that metric across the segment hosts.
IOWait
The percentage of CPU used waiting on IO requests.
Memory
The percentage of memory in use, the percentage of memory reserved for cache and buffers, and the minimum number of free kilobytes as a percentage of memory.
Note
Avoid reaching the point where the In Use percentage plus the Cache and Buffer percentage exceeds the Min Free Kbytes percentage. If it does, the free memory remaining may not be sufficient for the operating system to function normally, and you may experience query failures or even database crashes.
Command Center sources memory usage data from the Linux system file /proc/meminfo on each host. Note that Command Center’s results may be slightly different with the output of the “free” utility.
Command Center derives values from the
/proc/meminfofile as follows (the righthand porion of the equations are the fields from the/proc/meminfofile):- Total = MemTotal
- Free = MemFree
- Cache & Buffer = Buffers + Cached + SReclaimable
- Used = MemTotal - MemFree - (Buffers + Cached + SReclaimable)
Committed Memory
The percentage of Committed_AS memory in use.
Committed_AS represents the current amount of memory allocated on the system. It encompasses all memory allocated by processes, regardless of whether it has been utilized by them yet or not.
Disk I/O
Disk read and write rates in megabytes per second.
Network
Network I/O read and write rates in megabytes per second. Network metrics include traffic over all NICs (network interface cards), including internal interconnect and administrative traffic.
本人提供Oracle(OCP、OCM)、MySQL(OCP)、PostgreSQL(PGCA、PGCE、PGCM)等数据库的培训和考证业务,私聊QQ646634621或微信dbaup66,谢谢!

