合 PG性能采集分析工具之PoWA介绍
Tags: PGPostgreSQL监控powa-collectorPoWA性能采集
- 简介
- 一些连接
- 部署架构简介
- 数据库级性能指标
- General Overview
- Database Objects
- Details for all databases
- 实例级性能指标
- Background Writer
- Database Objects
- Details for all databases
- PoWA archivlist 部署介绍
- pg_qualstats 部署介绍
- pg_stat_kcache 部署介绍
- 配置
- 用法
- 更新扩展
- BUG 和限制
- pg_wait_sampling 部署介绍
- pg_track_settings 部署介绍
- HypoPG 部署介绍
- PoWA web 部署介绍
- PoWA collector 部署介绍
- 配置需要采集性能指标的实例信息
- 汇总所有插件部署方法
- 示例 总结
- 总结
- 参考
简介
PoWA--PostgreSQL 负载分析工具
本文主要介绍 PG 的一个性能采集和分析工具 PoWA 的部署方法和使用特点,该工具利用 PG 的扩展插件实现,其性能诊断分析能力比较接近 ORACLE AWR 报表功能。
PoWA是PostgreSQL 9.4及以后更新版本的性能工具,允许从各种Stats Extensions收集、聚合和清除多个 PostgreSQL 实例的统计信息,全称为PostgreSQL工作负载分析器(PostgreSQL Workload Analyzer)。
PoWA组成部分如下:
- PoWA-archivist是PostgreSQL的插件,收集其他插件获取到的性能统计数据。PoWA-archivist是PoWA的核心组件。其主要有如下2个部分:
- 名为“powa”的管理功能扩展。
- 名为“powa”的模块,可以选择作为后台工作程序运行,用以收集本地实例上的性能数据。
- PoWA-collector是在专用存储库服务器上,用于收集远程PostgreSQL实例性能指标的守护进程。
- PoWA-web是PoWA-collector收集到的性能指标的用户展示界面。
- 其它插件:安装于目标PostgreSQL数据库实例上的其他插件,其是性能指标数据的实际来源。
- PoWA:整个系统的总称。
除了pg_stat_statements、btree_gist、powa为必须的插件,PoWA还支持以下几个插件作为新能指标采集的扩展:
pg_qualstats:用于保存在WHERE语句和JOIN子句中发现的谓词的统计信息,powa 利用它来提供索引建议。
pg_stat_kcache:收集有关文件系统层的实际读取和写入的统计信息,可以用于观察SQL花费多少cpu等。
pg_wait_sampling:用于收集等待事件的采样统计信息,启用后它会收集如下两种统计信息:
历史等待事件。它被实现为内存中的环形缓冲区,其中每个进程等待事件的样本都以给定的(可配置的)周期写入。因此,对于每个正在运行的进程,用户可以根据历史大小(可配置)查看一些最近的样本。假设有一个客户端定期读取此历史记录并将其转储到某个地方,则用户可以拥有连续的历史记录。
等待分析,以内存hash表形式存在,表中存放每个进程和每个等待事件累积的样本,该表可以根据用户请求进行reset。假设有一个客户端定期转储并reset,用户可以统计一段时间内等待事件的详细。
pg_track_settings:该插件提供了一个可定期调用的函数(pg_tracksettingssnapshot())。 在每次调用时,它将存储自上次调用以来更改的设置。
Hypopg:类似MySQL虚拟索引。
pg_stat_statements:用于SQL语句监控。
一些连接
文档:https://powa.readthedocs.io/en/latest/
GitHub地址:https://github.com/powa-team
https://github.com/powa-team/powa-archivist
https://github.com/powa-team/powa-web
cpu, io消耗监控
https://github.com/powa-team/pg_stat_kcache
where条件过滤性统计
https://github.com/powa-team/pg_qualstats
官网提供了一个公网的例子,可以在线查看。
用户名:postgres
密码:postgres
部署架构简介
PoWA 4.0 之后的部署架构支持本地部署和远程部署。推荐用远程部署方式,部署架构图如下。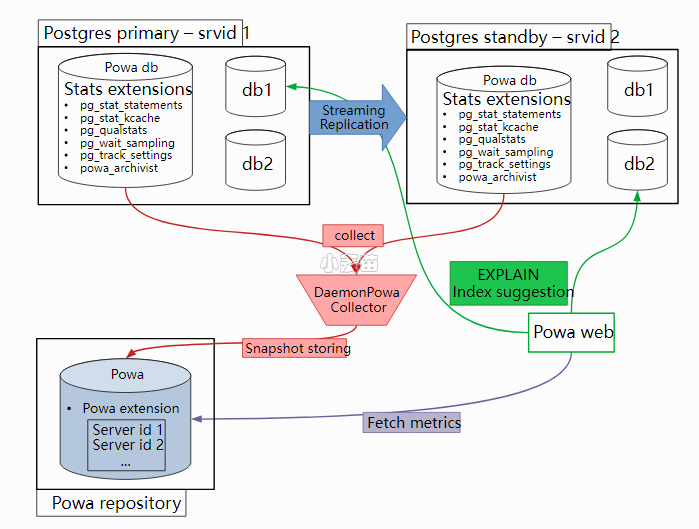
在每个 PG 实例里启用插件,在独立的服务器上部署采集程序 PoWA collector 和主程序 PoWA web。
上面架构图用到的插件简介如下:
pg_stat_statements:记录指定 PG 实例上所有 SQL 的统计信息,具体数据在视图pg_stat_statements上。pg_qualstats:采集 SQL 语句的where和join语句中的条件的统计信息。pg_stat_kcache:采集主机系统指标的统计信息。pg_wait_sampling:采集 SQL 语句的等待事件,并提供等待事件的汇总统计视图。pg_track_settings:主要是跟踪实例的参数配置变化。
在生产环境中,我们要做的是竟可能避免单个PG的powa库中的数据量过大。但是我们又要存放一段时间的快照信息用于性能分析,这个类似于Oracle的AWR快照信息。
这个时候我们就需要专门创建一个单独的powa数据库用于存储各个pg采集过来的数据。所以生产环境中我们基本上采取的远程模式部署powa。
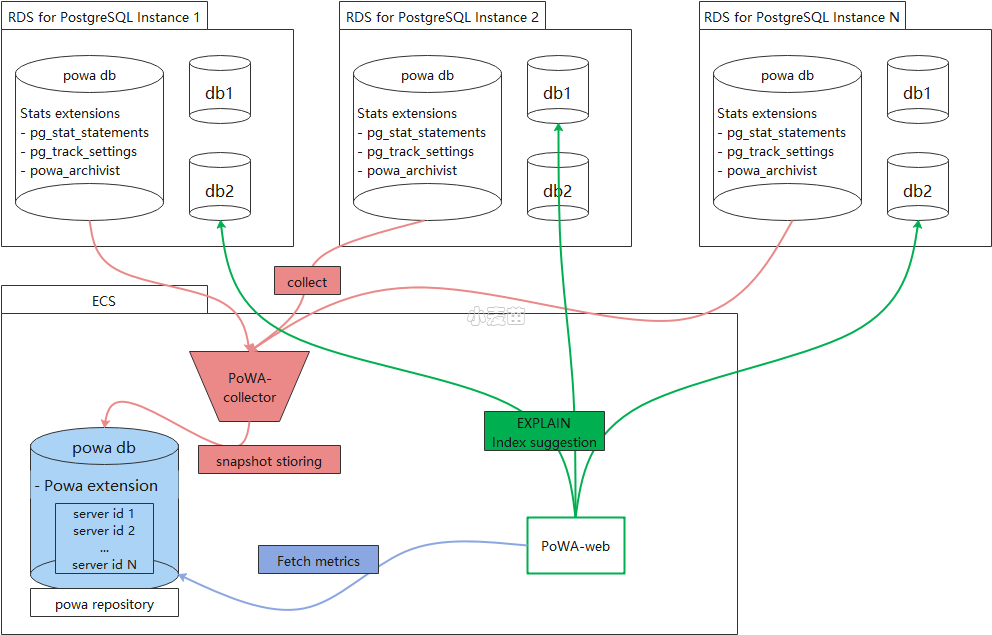
远程模式示意图
数据库级性能指标
General Overview
图1 General Overview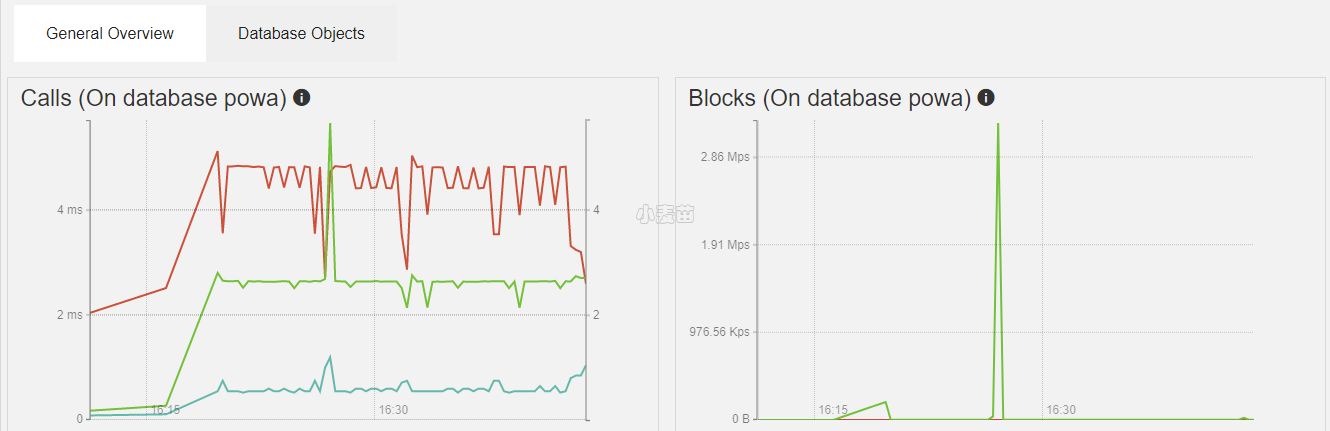
| 字段 | 中文解释 | 英文解释 |
|---|---|---|
| Queries per sec | 每秒执行查询的次数。 | Number of time the query has been executed,per second |
| Runtime per sec | 每秒内执行查询的总耗时。 | Total duration of queries executed,per second |
| Avg runtime | 查询的平均耗时。 | Average query duration |
| 字段 | 中文解释 | 英文解释 |
|---|---|---|
| Total shared buffers hit | 命中共享缓冲区的数据量。 | Amount of data found in shared buffers |
| Total shared buffers miss | 未命中共享缓冲区的数据量。 | Amount of data found in OS cache or read from disk。 |
Database Objects
图2 Database Objects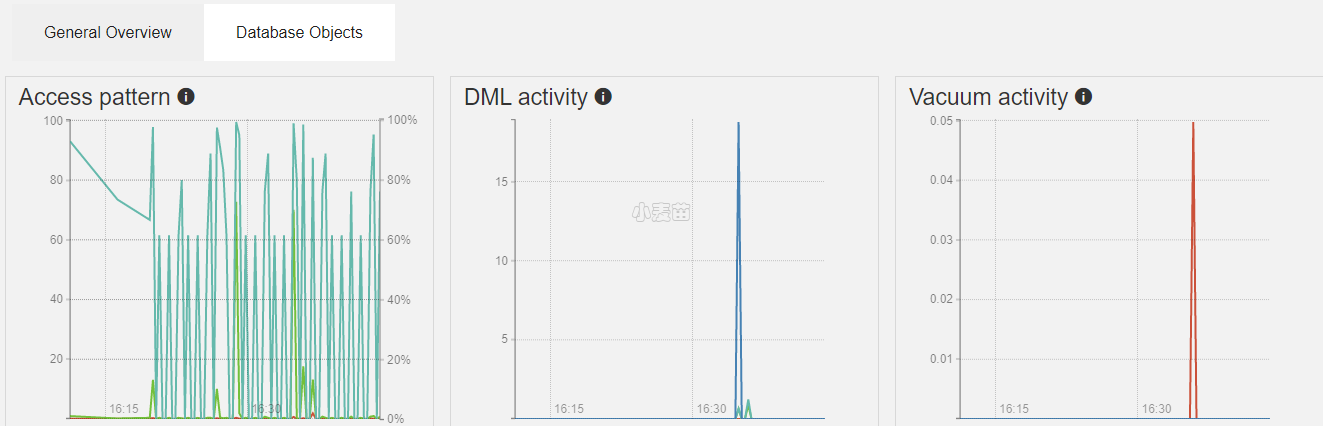
| 字段 | 中文解释 | 英文解释 |
|---|---|---|
| Index scans ratio | 索引扫描/序列扫描的比率。 | Ratio of index scan / seq scan |
| Index scans | 每秒索引扫描次数。 | Number of index scan per second |
| Sequential scans | 每秒顺序扫描次数。 | Number of sequential scan per second |
| 字段 | 中文解释 | 英文解释 |
|---|---|---|
| Tuples inserted | 每秒插入的行数。 | Number of tuples inserted per second |
| Tuples updated | 每秒更新的行数。 | Number of tuples updated per second |
| Tuples HOT updated | 每秒更新(HOT)的行数。 | Number of tuples HOT updated per second |
| Tuples deleted | 每秒删除的行数。 | Number of tuples deleted per second |
| 字段 | 中文解释 | 英文解释 |
|---|---|---|
| # Vacuum | 每秒手动清理的次数。 | Number of vacuum per second |
| # Autovacuum | 每秒自动清理的次数。 | Number of autovacuum per second |
| # Analyze | 每秒手动分析的次数。 | Number of analyze per second |
| # Autoanalyze | 每秒自动分析的次数。 | Number of autoanalyze per second |
Details for all databases
图3 Details for all databases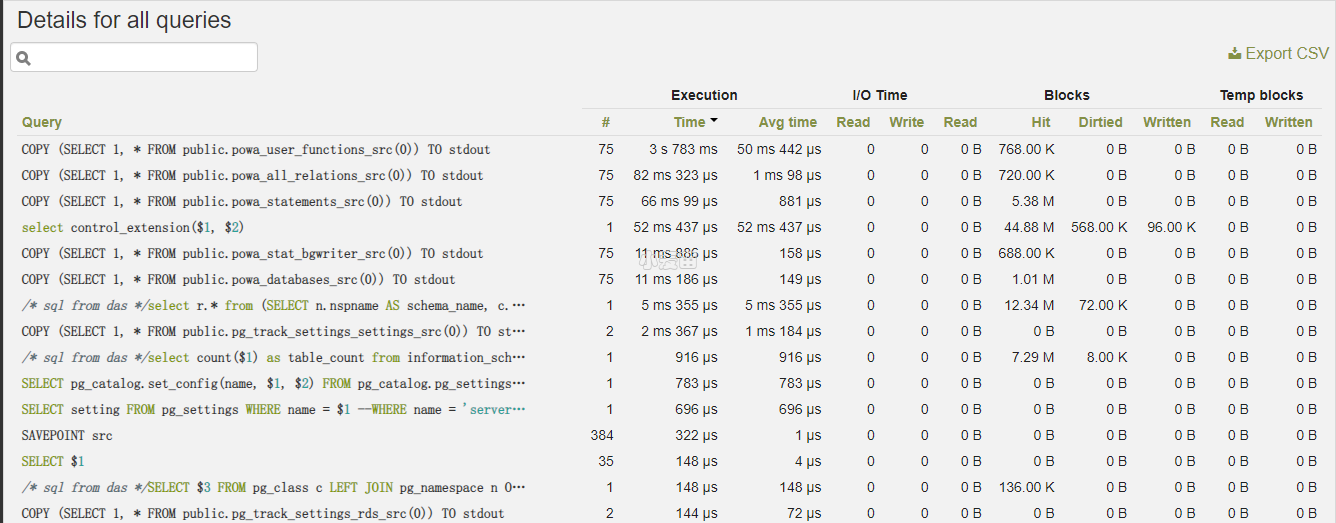
| 字段 | 注释 |
|---|---|
| Query | 执行的SQL。 |
| (Execution) # | 执行该SQL次数。 |
| (Execution) Time | 执行该SQL总时间。 |
| (Execution) Avg time | 执行该SQL平均时间。 |
| (I/O Time) Read | 读I/O等待时间。 |
| (I/O Time) Write | 写I/O等待时间。 |
| (Blocks) Read | 磁盘读页面数。 |
| (Blocks) Hit | 共享缓冲区命中页面数。 |
| (Blocks) Dirtied | 脏页面数。 |
| (Blocks) Written | 磁盘写页面数。 |
| (Temp blocks) Read | 磁盘读临时页面数。 |
| (Temp blocks) Write | 磁盘写临时页面数。 |
实例级性能指标
General Overview
图1 General Overview性能指标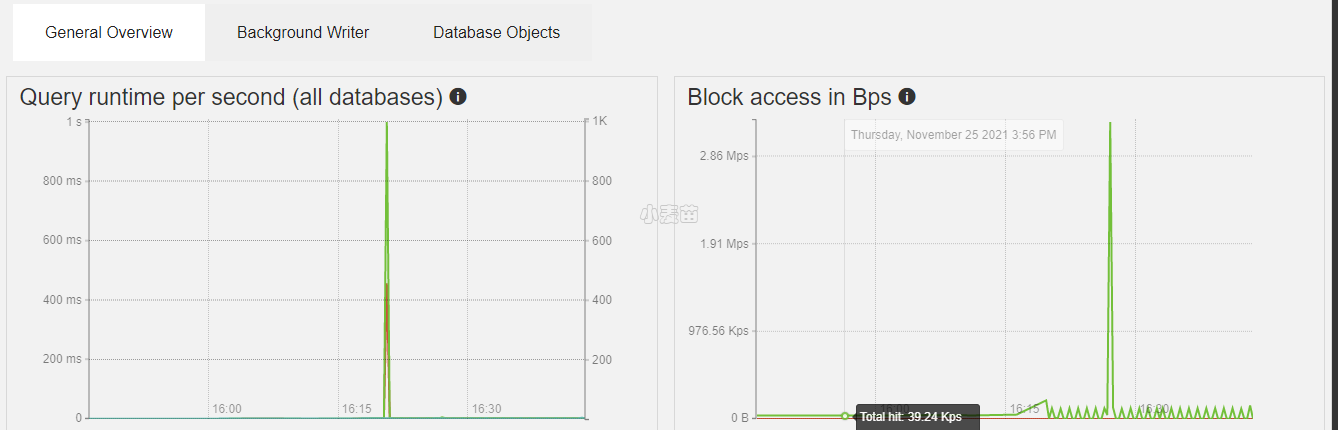
| 字段 | 中文解释 | 英文解释 |
|---|---|---|
| Queries per sec | 每秒执行查询的次数。 | Number of time the query has been executed, per second |
| Runtime per sec | 每秒执行的查询的总持续时间。 | Total duration of queries executed, per second |
| Avg runtime | 平均查询时长。 | Average query duration |
| 字段 | 中文解释 | 英文解释 |
|---|---|---|
| Total hit | 在共享缓冲区中找到的数据量。 | Amount of data found in shared buffers |
| Total read | 在操作系统缓存中找到或从磁盘读取的数据量。 | Amount of data found in OS cache or read from disk |
Background Writer
图2 Background Writer性能指标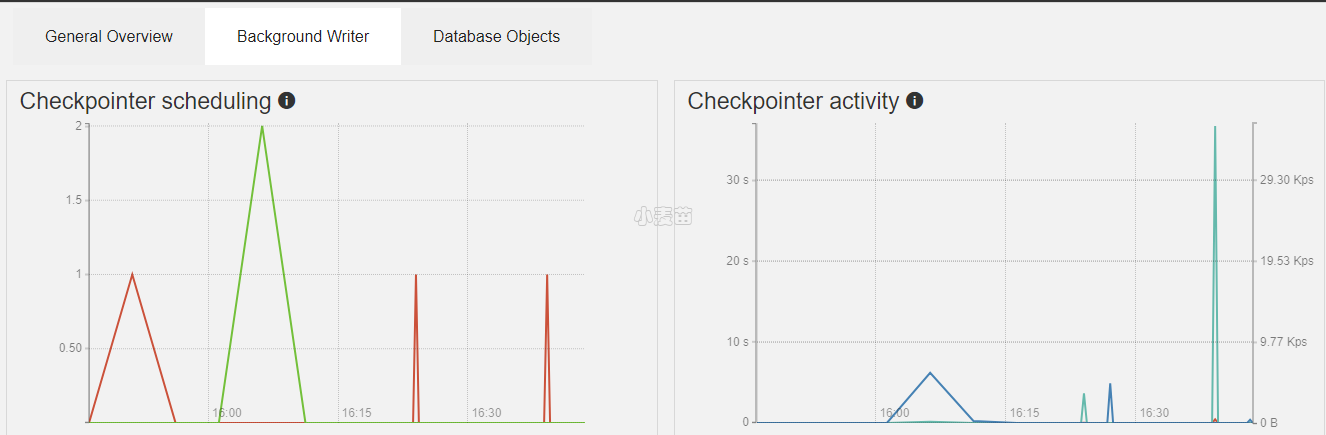
| 字段 | 中文解释 | 英文解释 |
|---|---|---|
| of requested checkpoints | 已执行的请求检查点数。 | Number of requested checkpoints that have been performed |
| of scheduled checkpoints | 已执行的预定检查点数。 | Number of scheduled checkpoints that have been performed |
| 字段 | 中文解释 | 英文解释 |
|---|---|---|
| Buffers alloc | 分配的缓冲区数。 | Number of buffers allocated |
| Sync time | 文件同步到磁盘的检查点处理部分所花费的总时间(单位 : 毫秒)。 | Total amount of time that has been spent in the portion of checkpoint processing where files are synchronized to disk, in milliseconds |
| Write time | 在将文件写入磁盘的检查点处理部分中花费的总时间(单位 : 毫秒)。 | Total amount of time that has been spent in the portion of checkpoint processing where files are written to disk, in milliseconds |
| 字段 | 中文解释 | 英文解释 |
|---|---|---|
| Maxwritten clean | 后台编写器因写入过多缓冲区而停止清理扫描的次数。 | Number of times the background writer stopped a cleaning scan because it had written too many buffers |
| Buffers clean | 后台写入器写入的缓冲区数。 | Number of buffers written by the background writer |
| 字段 | 中文解释 | 英文解释 |
|---|---|---|
| Buffers backend fsync | 后端必须执行自己的 fsync 调用的次数。 | Number of times a backend had to execute its own fsync call (normally the background writer handles those even when the backend does its own write) |
| Buffers backend | 后端直接写入的缓冲区数。 | Number of buffers written directly by a backend |
Database Objects
图3 Database Objects性能指标
| 字段 | 中文解释 | 英文解释 |
|---|---|---|
| Index scans ratio | 索引扫描/序列扫描的比率。 | Ratio of index scan / seq scan |
| Index scans | 每秒索引扫描次数。 | Number of index scan per second |
| Sequential scans | 每秒顺序扫描次数。 | Number of sequential scan per second |
| 字段 | 中文解释 | 英文解释 |
|---|---|---|
| Tuples inserted | 每秒插入的行数。 | Number of tuples inserted per second |
| Tuples updated | 每秒更新的行数。 | Number of tuples updated per second |
| Tuples HOT updated | 每秒更新(HOT)。 | Number of tuples HOT updated per second |
| Tuples deleted | 每秒删除的行数。 | Number of tuples deleted per second |
| 字段 | 中文解释 | 英文解释 |
|---|---|---|
| # Vacuum | 每秒手动清理的次数。 | Number of vacuum per second |
| # Autovacuum | 每秒自动清理的次数。 | Number of autovacuum per second |
| # Analyze | 每秒手动分析的次数。 | Number of analyze per second |
| # Autoanalyze | 每秒自动分析的次数。 | Number of autoanalyze per second |
Details for all databases
图4 Details for all databases性能指标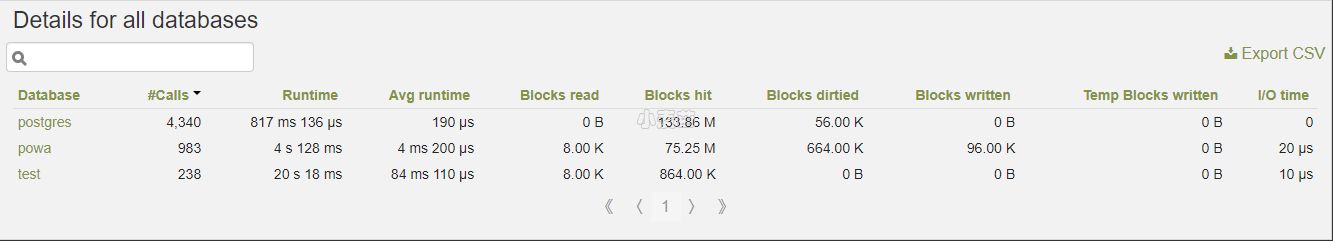
| 字段 | 注释 |
|---|---|
| Database | 数据库名称。 |
| #Calls | 执行SQL总数。 |
| Runtime | 执行SQL总耗时。 |
| Avg runtime | 执行SQL平均耗时。 |
| Blocks read | 磁盘读取的页面数。 |
| Blocks hit | 共享缓冲区命中的页面数。 |
| Blocks dirtied | 脏页数。 |
| Blocks written | 磁盘写页面数。 |
| Temp Blocks written | 磁盘写临时页面数。 |
| I/O time | I/O等待时间。 |
PoWA archivlist 部署介绍
参考:https://powa.readthedocs.io/en/latest/quickstart.html
简介
PoWA-archivlist 是 PoWA 项目的重要组件之一,它包含 2 个元素:
扩展
powa,包含一些管理用的函数。模块
powa,可选,在后台运行,采集本地实例的性能。
安装方法:
建议使用 PGDG 软件源里的安装包安装。rpm包下载:https://download.postgresql.org/pub/repos/yum/14/redhat/rhel-7-x86_64/
1 2 3 4 5 6 7 8 9 10 11 12 13 14 15 16 17 18 19 20 21 22 23 24 25 26 | -- debian apt-get -y install postgresql-14-powa -- CentOS yum yum install -y powa_14 -- 编译安装 wget https://github.com/powa-team/powa-archivist/archive/refs/tags/REL_4_1_4.tar.gz source /home/postgres/.bash_profile tar -zxvf REL_4_1_4.tar.gz powa-archivist-REL_4_1_4/ make && make install -- 创建插件 create database powa; \c powa create extension pg_stat_statements; create extension btree_gist; create extension powa; -- vi postgresql.conf track_io_timing = on shared_preload_libraries = 'pg_stat_statements,powa' pg_ctl restart |
在目标 PG 实例里创建数据库 powa 和相应的扩展。
1 2 3 4 5 6 7 8 9 10 11 | postgres=# create database powa; CREATE DATABASE postgres=# \c powa You are now connected to database "powa" as user "postgres". powa=# create extension powa; CREATE EXTENSION powa=# create extension btree_gist ; CREATE EXTENSION powa=# create extension powa; CREATE EXTENSION powa=# |
也可以用下面方式自动创建依赖的扩展。
1 2 3 4 5 6 7 8 9 10 11 12 13 14 15 16 17 18 19 | postgres=# drop database powa; DROP DATABASE postgres=# create database powa; CREATE DATABASE postgres=# \c powa; You are now connected to database "powa" as user "postgres". powa=# create extension powa cascade ; NOTICE: installing required extension "pg_stat_statements" NOTICE: installing required extension "btree_gist" CREATE EXTENSION powa=# \dx List of installed extensions Name | Version | Schema | Description --------------------+---------+------------+------------------------------------------------------------------------ btree_gist | 1.6 | public | support for indexing common datatypes in GiST pg_stat_statements | 1.9 | public | track planning and execution statistics of all SQL statements executed plpgsql | 1.0 | pg_catalog | PL/pgSQL procedural language powa | 4.1.4 | public | PostgreSQL Workload Analyser-core (4 rows) |
修改 PG 配置文件
安装完成后修改 postgresql.conf 里预加载的模块参数,需要重启 PG 实例才可以加载模块。
1 | shared_preload_libraries = 'pg_stat_statements' # (change requires restart) |
并且增加相应的参数控制记录不同 SQL 查询的个数(默认是1000,太少了)。
1 | pg_stat_statements.max = 10000 |
重启 PostgreSQL 实例,让配置生效。
查看使用示例
1 2 3 4 5 6 7 8 9 10 11 12 13 14 15 16 17 | powa=# \x auto Expanded display is used automatically. powa=# select query, calls, total_exec_time, rows from pg_stat_statements order by calls desc limit 2; -[ RECORD 1 ]---+-------------------------------------------------------------------------------------------------------------------------------------------------------------------------------------------------------------------------------------------------------------------------------------------------------------------------------------------- query | select spcname as TABLESPACENAME,pg_tablespace_size(spcname)/$1/$2 as total_mb,$3 as free, (select count(*) from pg_catalog.pg_database where dattablespace=a.OID) as datcount, (select rolname from pg_catalog.pg_authid where oid=b.oid) as ownuser from pg_catalog.pg_tablespace a left join pg_catalog.pg_roles b on a.spcowner=b.oid + calls | 254 total_exec_time | 9499.660649999998 rows | 508 -[ RECORD 2 ]---+-------------------------------------------------------------------------------------------------------------------------------------------------------------------------------------------------------------------------------------------------------------------------------------------------------------------------------------------- query | select a.*, b.* + | from + | (select sum(numbackends) numbackends, sum(xact_commit) xact_commit, sum(xact_rollback) xact_rollback, sum(blks_read) blks_read, sum(blks_hit) blks_hit, sum(tup_returned) tup_returned, sum(tup_fetched) tup_fetched, sum(tup_inserted) tup_inserted, sum(tup_updated) tup_updated, sum(tup_deleted) tup_deleted, + | sum(conflicts) conflicts, sum(temp_files) temp_files, sum(temp_bytes) temp_bytes, sum(deadlocks) deadlocks + | from pg_stat_database) a, (select * from pg_stat_bgwriter) b calls | 252 total_exec_time | 3321.225349999999 rows | 252 |
如果需要本地信息收集,PoWA-archivist可作为后台进程去收集。但是对应的library需要在参数文件中配置且重启生效。
1 2 3 4 5 6 7 8 9 10 11 12 13 14 15 16 17 18 19 20 21 22 23 | postgres=# \dx List of installed extensions Name | Version | Schema | Description --------------------+---------+------------+------------------------------------------------------------------------ btree_gist | 1.6 | public | support for indexing common datatypes in GiST pageinspect | 1.9 | public | inspect the contents of database pages at a low level pg_dirtyread | 2 | public | Read dead but unvacuumed rows from table pg_stat_statements | 1.9 | public | track planning and execution statistics of all SQL statements executed plpgsql | 1.0 | pg_catalog | PL/pgSQL procedural language powa | 4.1.4 | public | PostgreSQL Workload Analyser-core (6 rows) postgres=# \q [postgres@pg147 data]$ pg_ctl restart waiting for server to shut down.... done server stopped waiting for server to start....2023-04-03 16:22:42.657 CST [460695] LOG: redirecting log output to logging collector process 2023-04-03 16:22:42.657 CST [460695] HINT: Future log output will appear in directory "pg_log". done server started [postgres@pg147 data]$ ps -ef|grep powa postgres 460703 460695 0 16:22 ? 00:00:00 postgres: powa idle [postgres@pg147 data]$ |
pg_qualstats 部署介绍
https://github.com/powa-team/pg_qualstats
简介pg_qualstats 主要是采集 SQL 语句的 where 和 join 语句中的条件的统计信息,帮助 DBA 分析下面问题:
使用这个列查询的语句集合是哪些?
where语句里常用的查询条件的值是哪些?where语句里常用的查询条件是哪些?
安装方式
1 2 3 4 5 6 7 8 9 10 11 | -- Debian apt -y install postgresql-14-pg-qualstats -- Centos yum install -y pg_qualstats_14 -- 编译安装 wget https://github.com/powa-team/pg_qualstats/archive/refs/tags/2.0.4.tar.gz tar zxvf pg_qualstats-2.0.4.tar.gz cd pg_qualstats-2.0.4 make && sudo make install |
在目标 PG 实例的数据库 powa 创建相应的扩展。
1 | CREATE EXTENSION pg_qualstats; |
修改 PG 配置文件。
安装完成后修改 postgresql.conf 里预加载的模块参数,需要重启 PG 实例才可以加载模块。
1 | shared_preload_libraries = 'pg_stat_statements,pg_qualstats' # (change requires restart) |
下面是插件相关的参数,也在 postgresql.conf 里添加。
1 2 3 4 5 6 | pg_qualstats.enabled = true pg_qualstats.max = 10000 pg_qualstats.track_pg_catalog = false pg_qualstats.resolve_oids = false pg_qualstats.track_constants = true pg_qualstats.sample_rate = 0.1 |
pg_stat_kcache 部署介绍
简介pg_stat_kcache :采集主机系统指标的统计信息。这个扩展可以帮助 DBA 查看每个查询、用户或数据库消耗的主机资源。主机资源包括:
CPU (user time 和 system time)
物理磁盘访问读写次数
安装方式
1 2 3 4 5 6 7 8 | apt -y install postgresql-14-pg-stat-kcache -- 编译安装 wget https://github.com/powa-team/pg_stat_kcache/archive/REL2_2_1.tar.gz -O pg_stat_kcache-REL2_2_1.tar.gz tar zxvf pg_stat_kcache-REL2_2_1.tar.gz cd pg_stat_kcache-REL2_2_1 make make install |
在目标 PG 实例的数据库 powa 创建相应的扩展
1 | CREATE EXTENSION pg_stat_kcache; |
修改 PG 配置文件。
安装完成后修改 postgresql.conf 里预加载的模块参数,需要重启 PG 实例才可以加载模块。
1 | shared_preload_libraries = 'pg_stat_statements,pg_qualstats,pg_stat_kcache' # (change requires restart) |
pg_stat_kcache 采集的记录数跟插件 pg_stat_statements 的参数保持一致。
重启实例后在 powa 库中执行下面语句:
1 | SELECT powa_kcache_register(); |
配置
可以在 postgresql.conf 中配置以下 GUC:
- pg_stat_kcache.linux_hz (int, default -1): 通知 pg_stat_kcache linux CONFIG_HZ 配置选项。 pg_stat_kcache 使用它来补偿采样错误。默认值为-1,尝试在启动时猜测它。
- pg_stat_kcache.track (enum, default top): 控制哪些语句被 pg_stat_kcache 跟踪。指定 top 以跟踪顶级语句(由客户端直接发出的语句), all 也跟踪嵌套语句(例如在函数中调用的语句),或 none 以禁用语句统计收集。
- pg_stat_kcache.track_planning (bool, default off): 控制pg_stat_kcache是否跟踪计划操作和持续时间(需要PostgreSQL 13或更高版本)。
用法
扩展pg_stat_kcache 创建几个对象。
视图pg_stat_kcache
| Name | Type | Description |
|---|---|---|
| datname | name | Name of the database |
| plan_user_time | double precision | User CPU time used planning statements in this database, in seconds and milliseconds (if pg_stat_kcache.track_planning is enabled, otherwise zero)在此数据库中计划语句使用的用户 CPU 时间,以秒和毫秒为单位(如果启用 pg_stat_kcache.track_planning,否则为零) |
| plan_system_time | double precision | System CPU time used planning statements in this database, in seconds and milliseconds (if pg_stat_kcache.track_planning is enabled, otherwise zero)此数据库中计划语句使用的系统 CPU 时间,以秒和毫秒为单位(如果启用 pg_stat_kcache.track_planning,否则为零) |
| plan_minflts | bigint | Number of page reclaims (soft page faults) planning statements in this database (if pg_stat_kcache.track_planning is enabled, otherwise zero)此数据库中的页面回收(软页面错误)计划语句数(如果启用了 pg_stat_kcache.track_planning,否则为零) |
| plan_majflts | bigint | Number of page faults (hard page faults) planning statements in this database (if pg_stat_kcache.track_planning is enabled, otherwise zero)此数据库中的页面错误(硬页面错误)计划语句数(如果启用了 pg_stat_kcache.track_planning,否则为零) |
| plan_nswaps | bigint | Number of swaps planning statements in this database (if pg_stat_kcache.track_planning is enabled, otherwise zero)此数据库中的交换计划语句数(如果启用了 pg_stat_kcache.track_planning,否则为零) |
| plan_reads | bigint | Number of bytes read by the filesystem layer planning statements in this database (if pg_stat_kcache.track_planning is enabled, otherwise zero)此数据库中文件系统层规划语句读取的字节数(如果启用了 pg_stat_kcache.track_planning,否则为零) |
| plan_reads_blks | bigint | Number of 8K blocks read by the filesystem layer planning statements in this database (if pg_stat_kcache.track_planning is enabled, otherwise zero)此数据库中文件系统层规划语句读取的 8K 块数(如果启用了 pg_stat_kcache.track_planning,否则为零) |
| plan_writes | bigint | Number of bytes written by the filesystem layer planning statements in this database (if pg_stat_kcache.track_planning is enabled, otherwise zero)此数据库中文件系统层规划语句写入的字节数(如果启用了 pg_stat_kcache.track_planning,否则为零) |
| plan_writes_blks | bigint | Number of 8K blocks written by the filesystem layer planning statements in this database (if pg_stat_kcache.track_planning is enabled, otherwise zero)此数据库中文件系统层规划语句读取的 8K 块数(如果启用了 pg_stat_kcache.track_planning,否则为零) |
| plan_msgsnds | bigint | Number of IPC messages sent planning statements in this database (if pg_stat_kcache.track_planning is enabled, otherwise zero)此数据库中发送计划语句的 IPC 消息数(如果启用 pg_stat_kcache.track_planning,否则为零) |
| plan_msgrcvs | bigint | Number of IPC messages received planning statements in this database (if pg_stat_kcache.track_planning is enabled, otherwise zero)在这个数据库中接收到计划语句的 IPC 消息数(如果启用了 pg_stat_kcache.track_planning,否则为零) |
| plan_nsignals | bigint | Number of signals received planning statements in this database (if pg_stat_kcache.track_planning is enabled, otherwise zero)在此数据库中接收到规划语句的信号数(如果启用了 pg_stat_kcache.track_planning,否则为零) |
| plan_nvcsws | bigint | Number of voluntary context switches planning statements in this database (if pg_stat_kcache.track_planning is enabled, otherwise zero)此数据库中自愿上下文切换计划语句的数量(如果启用了 pg_stat_kcache.track_planning,否则为零) |
| plan_nivcsws | bigint | Number of involuntary context switches planning statements in this database (if pg_stat_kcache.track_planning is enabled, otherwise zero)此数据库中非自愿上下文切换计划语句的数量(如果启用了 pg_stat_kcache.track_planning,否则为零) |
| exec_user_time | double precision | User CPU time used executing statements in this database, in seconds and milliseconds 用户在此数据库中执行语句所使用的 CPU 时间,以秒和毫秒为单位 |
| exec_system_time | double precision | System CPU time used executing statements in this database, in seconds and milliseconds 在此数据库中执行语句所使用的系统 CPU 时间,以秒和毫秒为单位 |
| exec_minflts | bigint | Number of page reclaims (soft page faults) executing statements in this database 在此数据库中执行语句的页面回收(软页面错误)数 |
| exec_majflts | bigint | Number of page faults (hard page faults) executing statements in this database此数据库中执行语句的页错误(硬页错误)数 |
| exec_nswaps | bigint | Number of swaps executing statements in this database 此数据库中执行语句的交换数 |
| exec_reads | bigint | Number of bytes read by the filesystem layer executing statements in this database 文件系统层在此数据库中执行语句读取的字节数 |
| exec_reads_blks | bigint | Number of 8K blocks read by the filesystem layer executing statements in this database 文件系统层在此数据库中执行语句读取的 8K 块数 |
| exec_writes | bigint | Number of bytes written by the filesystem layer executing statements in this database 文件系统层在此数据库中执行语句写入的字节数 |
| exec_writes_blks | bigint | Number of 8K blocks written by the filesystem layer executing statements in this database 该数据库中文件系统层执行语句写入的 8K 块数 |
| exec_msgsnds | bigint | Number of IPC messages sent executing statements in this database 在此数据库中执行语句发送的 IPC 消息数 |
| exec_msgrcvs | bigint | Number of IPC messages received executing statements in this database在此数据库中执行语句接收到的 IPC 消息数 |
| exec_nsignals | bigint | Number of signals received executing statements in this database在此数据库中执行语句接收到的信号数 |
| exec_nvcsws | bigint | Number of voluntary context switches executing statements in this database在此数据库中执行语句的自愿上下文切换数 |
| exec_nivcsws | bigint | Number of involuntary context switches executing statements in this database 在此数据库中执行语句的非自愿上下文切换数 |
视图pg_stat_kcache_detail
| Name | Type | Description |
|---|---|---|
| query | text | Query text |
| top | bool | True if the statement is top-level |
| datname | name | Database name |
| rolname | name | Role name |
| plan_user_time | double precision | User CPU time used planning the statement, in seconds and milliseconds (if pg_stat_kcache.track_planning is enabled, otherwise zero) |
| plan_system_time | double precision | System CPU time used planning the statement, in seconds and milliseconds (if pg_stat_kcache.track_planning is enabled, otherwise zero) |
| plan_minflts | bigint | Number of page reclaims (soft page faults) planning the statement (if pg_stat_kcache.track_planning is enabled, otherwise zero) |
| plan_majflts | bigint | Number of page faults (hard page faults) planning the statement (if pg_stat_kcache.track_planning is enabled, otherwise zero) |
| plan_nswaps | bigint | Number of swaps planning the statement (if pg_stat_kcache.track_planning is enabled, otherwise zero) |
| plan_reads | bigint | Number of bytes read by the filesystem layer planning the statement (if pg_stat_kcache.track_planning is enabled, otherwise zero) |
| plan_reads_blks | bigint | Number of 8K blocks read by the filesystem layer planning the statement (if pg_stat_kcache.track_planning is enabled, otherwise zero) |
| plan_writes | bigint | Number of bytes written by the filesystem layer planning the statement (if pg_stat_kcache.track_planning is enabled, otherwise zero) |
| plan_writes_blks | bigint | Number of 8K blocks written by the filesystem layer planning the statement (if pg_stat_kcache.track_planning is enabled, otherwise zero) |
| plan_msgsnds | bigint | Number of IPC messages sent planning the statement (if pg_stat_kcache.track_planning is enabled, otherwise zero) |
| plan_msgrcvs | bigint | Number of IPC messages received planning the statement (if pg_stat_kcache.track_planning is enabled, otherwise zero) |
| plan_nsignals | bigint | Number of signals received planning the statement (if pg_stat_kcache.track_planning is enabled, otherwise zero) |
| plan_nvcsws | bigint | Number of voluntary context switches planning the statement (if pg_stat_kcache.track_planning is enabled, otherwise zero) |
| plan_nivcsws | bigint | Number of involuntary context switches planning the statement (if pg_stat_kcache.track_planning is enabled, otherwise zero) |
| exec_user_time | double precision | User CPU time used executing the statement, in seconds and milliseconds |
| exec_system_time | double precision | System CPU time used executing the statement, in seconds and milliseconds |
| exec_minflts | bigint | Number of page reclaims (soft page faults) executing the statements |
| exec_majflts | bigint | Number of page faults (hard page faults) executing the statements |
| exec_nswaps | bigint | Number of swaps executing the statements |
| exec_reads | bigint | Number of bytes read by the filesystem layer executing the statements |
| exec_reads_blks | bigint | Number of 8K blocks read by the filesystem layer executing the statements |
| exec_writes | bigint | Number of bytes written by the filesystem layer executing the statements |
| exec_writes_blks | bigint | Number of 8K blocks written by the filesystem layer executing the statements |
| exec_msgsnds | bigint | Number of IPC messages sent executing the statements |
| exec_msgrcvs | bigint | Number of IPC messages received executing the statements |
| exec_nsignals | bigint | Number of signals received executing the statements |
| exec_nvcsws | bigint | Number of voluntary context switches executing the statements |
| exec_nivcsws | bigint | Number of involuntary context switches executing the statements |
函数pg_stat_kcache_reset
重置 pg_stat_kcache 收集的统计信息。可以由超级用户调用:
1 | select pg_stat_kcache_reset(); |
函数pg_stat_kcache function
此函数是一个集合返回函数,它转储共享内存结构的计数器的包含。该函数由 pg_stat_kcache 视图使用。任何用户都可以调用该函数:
1 | SELECT * FROM pg_stat_kcache(); |
它提供了以下列:
| Name | Type | Description |
|---|---|---|
| queryid | bigint | pg_stat_statements’ query identifier |
| top | bool | True if the statement is top-level |
| userid | oid | Database OID |
| dbid | oid | Database OID |
| plan_user_time | double precision | User CPU time used planning the statement, in seconds and milliseconds (if pg_stat_kcache.track_planning is enabled, otherwise zero) |
| plan_system_time | double precision | System CPU time used planning the statement, in seconds and milliseconds (if pg_stat_kcache.track_planning is enabled, otherwise zero) |
| plan_minflts | bigint | Number of page reclaims (soft page faults) planning the statement (if pg_stat_kcache.track_planning is enabled, otherwise zero) |
| plan_majflts | bigint | Number of page faults (hard page faults) planning the statement (if pg_stat_kcache.track_planning is enabled, otherwise zero) |
| plan_nswaps | bigint | Number of swaps planning the statement (if pg_stat_kcache.track_planning is enabled, otherwise zero) |
| plan_reads | bigint | Number of bytes read by the filesystem layer planning the statement (if pg_stat_kcache.track_planning is enabled, otherwise zero) |
| plan_reads_blks | bigint | Number of 8K blocks read by the filesystem layer planning the statement (if pg_stat_kcache.track_planning is enabled, otherwise zero) |
| plan_writes | bigint | Number of bytes written by the filesystem layer planning the statement (if pg_stat_kcache.track_planning is enabled, otherwise zero) |
| plan_writes_blks | bigint | Number of 8K blocks written by the filesystem layer planning the statement (if pg_stat_kcache.track_planning is enabled, otherwise zero) |
| plan_msgsnds | bigint | Number of IPC messages sent planning the statement (if pg_stat_kcache.track_planning is enabled, otherwise zero) |
| plan_msgrcvs | bigint | Number of IPC messages received planning the statement (if pg_stat_kcache.track_planning is enabled, otherwise zero) |
| plan_nsignals | bigint | Number of signals received planning the statement (if pg_stat_kcache.track_planning is enabled, otherwise zero) |
| plan_nvcsws | bigint | Number of voluntary context switches planning the statement (if pg_stat_kcache.track_planning is enabled, otherwise zero) |
| plan_nivcsws | bigint | Number of involuntary context switches planning the statement (if pg_stat_kcache.track_planning is enabled, otherwise zero) |
| exec_user_time | double precision | User CPU time used executing the statement, in seconds and milliseconds |
| exec_system_time | double precision | System CPU time used executing the statement, in seconds and milliseconds |
| exec_minflts | bigint | Number of page reclaims (soft page faults) executing the statements |
| exec_majflts | bigint | Number of page faults (hard page faults) executing the statements |
| exec_nswaps | bigint | Number of swaps executing the statements |
| exec_reads | bigint | Number of bytes read by the filesystem layer executing the statements |
| exec_reads_blks | bigint | Number of 8K blocks read by the filesystem layer executing the statements |
| exec_writes | bigint | Number of bytes written by the filesystem layer executing the statements |
| exec_writes_blks | bigint | Number of 8K blocks written by the filesystem layer executing the statements |
| exec_msgsnds | bigint | Number of IPC messages sent executing the statements |
| exec_msgrcvs | bigint | Number of IPC messages received executing the statements |
| exec_nsignals | bigint | Number of signals received executing the statements |
| exec_nvcsws | bigint | Number of voluntary context switches executing the statements |
| exec_nivcsws | bigint | Number of involuntary context switches executing the statements |
更新扩展
请注意,除了 SQL 对象之外的更改需要重新启动 PostgreSQL。大多数新代码将在重启完成后立即启用,无论扩展是否更新,因为扩展只负责在 SQL 中公开内部数据结构。
另请注意,当 set-returning 函数字段发生更改时,需要重新启动 PostgreSQL 才能加载新版本的扩展。在重新启动完成之前,更新扩展程序将失败,并显示类似于以下内容的消息:
在文件 …/pg_stat_kcache.so 中找不到函数“pg_stat_kcache_2_2”
BUG 和限制
没有已知的BUG。
跟踪规划器资源使用情况需要 PostgreSQL 13 或更高版本。
我们假设一个内核块是 512 字节。这对于 Linux 来说是正确的,但对于另一个 Unix 实现可能不是这样。